Introduction
This is a two-part post in which I will share my personal benchmarking results from MongoDB 3.6 to 8.0.
The idea of breaking the articles into different parts was to make the reading more dynamic. In this first part, I will explain more about the reasons and how the process was done, while Part 2 will focus on the results themselves.
If you want to jump to Part 2, you can click on the link below. Otherwise, you can follow along with this first part for more details and to understand the objective, test suite, and how the benchmark was performed.
Objective
The objective and motivation are pretty simple, I would say:
Understand If the Mongo database performance has changed over the years(releases).
That’s because this question is refreshed with every new major release; Customers always get in contact, sharing their concerns about possible performance regression when moving to a newer release.
Although it’s not very clear and organized the way this information is presented, we do have other users performing benchmarks and reporting related issues about performance loss when moving over the releases:
- MongoDB 4.2 vs 4.0, 3.6, 3.4, and 3.2 Benchmarks
- MongoDB 3.4 vs 4.4 vs 5.0 vs 6.0
- SERVER-51104
- SERVER-36875
- Performance degradation after upgrading to 4.4
That being said, this benchmark test aims to address these concerns by evaluating the performance of different MongoDB versions in a controlled and single environment.
While this test is not intended to be the definitive word on MongoDB performance, it aims to serve as a well-organized effort to illuminate that matter across all the tested versions, contributing to a broader conversation about it.
Test Suite
Database server with the following configuration profile:
- CPU: AMD Ryzen(TM) 7 5800X — 8C/16T
- RAM: 16 GB DDR4 at 3200 MHz (2 x 8 GB).
- Disks: 512GB(SSD) -> OS and Database installation. | 512GB(NVMe) -> MongoDB dbpath.
- OS: Oracle Linux 8.10.
- Kernel: 4.18.0–553.el8_10.x86_64
For the Client server, it had the following configuration profile:
- CPU: Intel(R) Core(TM) i7–9750H CPU
- RAM: 32 GB DDR4 at 2666 MHz (2 x 16 GB).
- OS: Oracle Linux 8.10.
- Kernel: 4.18.0–553.el8_10.x86_64
Topology
Single-node Replica Set.
This topology was chosen because the focus isn’t on replication latency, flow control, scattered gather queries, secondary reads, or any other features that could influence raw performance. Instead, the objective is to evaluate how MongoDB’s performance has changed across different versions without the influence of additional complexities.
Configuration
On the OS side for the database, all the production notes and best practices were applied accordingly:
- Production Notes for Self-Managed Deployments
- Operations Checklist for Self-Managed Deployments
- MongoDB Best Practices
# Percona Toolkit System Summary Report ######################
        Date | 2024-10-06 16:25:22 UTC (local TZ: -03 -0300)
    Hostname | pc-oraclelinux8
      Uptime | 2 days, 12 min,  3 users,  load average: 0.00, 0.00, 0.02
      System | Gigabyte Technology Co., Ltd.; X570S I AORUS PRO AX; v-CF (Desktop)
    Platform | Linux
     Release | Red Hat Enterprise Linux release 8.10 (Ootpa)
      Kernel | 4.18.0-553.el8_10.x86_64
Architecture | CPU = 64-bit, OS = 64-bit
   Threading | NPTL 2.28
     SELinux | Disabled
 Virtualized | No virtualization detected

# Processor ##################################################
  Processors | physical = 1, cores = 8, virtual = 16, hyperthreading = yes
      Speeds | 1x3614.310, 15x3800.000
      Models | 16xAMD Ryzen 7 5800X 8-Core Processor
      Caches | 16x512 KB

# Memory #####################################################
       Total | 15.5G
        Free | 1.3G
        Used | physical = 9.1G, swap allocated = 7.8G, swap used = 3.0M, virtual = 9.1G
      Shared | 76.1M
     Buffers | 5.1G
      Caches | 6.2G
       Dirty | 140 kB
     UsedRSS | 10.0G
  Swappiness | 1
   DirtyPolicy | 15, 5
   DirtyStatus | 0, 0
    Numa Nodes | 1
   Numa Policy | default
Preferred Node | current
  Node     Size         Free         CPUs
  ====     ====         ====         ====
  node0    15913 MB     1374 MB      0 1 2 3 4 5 6 7 8 9 10 11 12 13 14 15

  Locator    Size       Speed             Form Factor   Type          Type Detail
  =========  ========   ================= ============= ============= ========================================
  DIMM 1     8 GB       3200 MT/s         DIMM          DDR4          Synchronous Unbuffered (Unregistered)
  DIMM 1     8 GB       3200 MT/s         DIMM          DDR4          Synchronous Unbuffered (Unregistered)
  DIMM 0     {EMPTY}                      Unknown       Unknown       Unknown
  DIMM 0     {EMPTY}                      Unknown       Unknown       Unknown

# Mounted Filesystems ########################################
  Filesystem                         Size   Used  Type   Opts                                                                                        Mountpoint
  /dev/mapper/ol_oraclelinux8-home   387G   1%    xfs    rw,noatime,attr2,inode64,logbufs=8,logbsize=32k,noquota                                       /home
  /dev/mapper/ol_oraclelinux8-root   70G    14%   xfs    rw,relatime,attr2,inode64,logbufs=8,logbsize=32k,noquota                                      /
  /dev/nvme0n1p1                     96M    33%   vfat   rw,relatime,fmask=0077,dmask=0077,codepage=437,iocharset=ascii,shortname=winnt,errors=remount-ro /boot/efi
  /dev/nvme0n1p2                     1014M  46%   xfs    rw,relatime,attr2,inode64,logbufs=8,logbsize=32k,noquota                                      /boot
  /dev/nvme1n1                       466G   2%    xfs    rw,noatime,attr2,inode64,logbufs=8,logbsize=32k,noquota                                       /mnt/nvme-mongodb

# Disk Schedulers And Queue Size #############################
        dm-0 | 128
        dm-1 | 128
        dm-2 | 128
     nvme0n1 | [mq-deadline] 256
     nvme1n1 | [mq-deadline] 256

# Kernel Inode State #########################################
 dentry-state | 157146 131332 45 0 76070 0
      file-nr | 7488 0 1617863
     inode-nr | 80659 633

# Network Config #############################################
   Controller | Intel Corporation Ethernet Controller I225-V (rev 01)
  FIN Timeout | 30
   Port Range | 60999

# Simplified and fuzzy rounded vmstat ########################
 procs  ---swap-- -----io---- ---system---- --------cpu--------
  r  b    si   so    bi    bo     ir     cs   us  sy  il  wa  st
  1  0     0    0     1    70      1      7    1   0  99   0   0
  7  0     0    0     0     0   5000   4500    1   1  98   0   0
  0  0     0    0     0     4   3000   3000    1   0  99   0   0
  0  0     0    0     0     0    400    500    0   0 100   0   0
  0  0     0    0     0     0    300    450    0   0 100   0   0

$ sudo blockdev --getra /dev/mapper/ol_oraclelinux8-home
16

$ sudo blockdev --getra /dev/nvme1n1
16

$ cat /proc/$(pgrep mongod)/limits
Limit                     Soft Limit           Hard Limit           Units
Max cpu time              unlimited            unlimited            seconds
Max file size             unlimited            unlimited            bytes
Max data size             unlimited            unlimited            bytes
Max stack size            8388608              unlimited            bytes
Max core file size        0                    unlimited            bytes
Max resident set          unlimited            unlimited            bytes
Max processes             64000                64000                processes
Max open files            64000                64000                files
Max locked memory         unlimited            unlimited            bytes
Max address space         unlimited            unlimited            bytes
Max file locks            unlimited            unlimited            locks
Max pending signals       127401               127401               signals
Max msgqueue size         819200               819200               bytes
Max nice priority         0                    0
Max realtime priority     0                    0
Max realtime timeout      unlimited            unlimited            us
On the Database side, the instance is running with default parameters with only Replica Set and Authorization enabled:
rs0:PRIMARY> db.adminCommand({ getCmdLineOpts: 1 })
{
"argv" : [
 "/usr/bin/mongod",
 "-f",
 "/etc/mongod.conf"
],
"parsed" : {
 "config" : "/etc/mongod.conf",
 "net" : {
  "bindIp" : "127.0.0.1, 192.168.15.50",
  "port" : 27017
 },
 "processManagement" : {
  "fork" : true,
  "pidFilePath" : "/var/run/mongodb/mongod.pid",
  "timeZoneInfo" : "/usr/share/zoneinfo"
 },
 "replication" : {
  "replSetName" : "rs0"
 },
 "security" : {
  "authorization" : "enabled",
  "keyFile" : "/mnt/nvme-mongodb/keys/keyfile"
 },
 "storage" : {
  "dbPath" : "/mnt/nvme-mongodb/data",
  "journal" : {
   "enabled" : true
  }
 },
 "systemLog" : {
  "destination" : "file",
  "logAppend" : true,
  "path" : "/var/log/mongodb/mongod.log"
 }
}
Benchmarking tool
The tool used for this test was the mongo-perf.
- Driver version — PyMongo 4.4.0.
- Python version — Python3.8.
As per the Compatibility documentation, PyMongo 4.4.0 and Python3.8 provide all the necessary compatibility needed from 3.6 to 8.0.
The mongo-perf tool utilizes Python scripts to conduct specific test runs that evaluate various aspects of performance. Currently, around 34 test case scripts are available for use, but I did not use all of them.
For the tests, the following scripts were selected:
- simple_insert.js
- simple_update.js
- simple_query.js
- simple_remove.js
- complex_insert.js
- complex_update.js
- partial_index.js
The choice of those selected scripts is because they can comprehensively test the basics of CRUD operations.
The simple_insert.js, simple_update.js, simple_query.js, and simple_remove.js cover the basics of document creation, modification, retrieval, and deletion. The complex_update.js adds complexity by involving advanced operations and multiple indexes. complex_insert.js and partial_index.js evaluate performance under more demanding scenarios, such as sequential and random inserts, with and without contention, involving large values and multi-key indexes.
Methodology and Final Consideration
This test was conducted at the dawn of MongoDB 8.0’s release, and the latest available patch releases of the other versions were used accordingly:
- 3.6.23 -> 4.0.28 -> 4.2.25 -> 4.4.29 -> 5.0.29 -> 6.0.18 -> 7.0.14 -> 8.0.0.
Red Hat 8 was chosen as the system exclusively due to its high compatibility across the tested versions. Later in this section, I further detail the tests, but below, we have a diagram showing how the MongoDB versions were tested.
- Each release was tested following the upgrade patch approach:
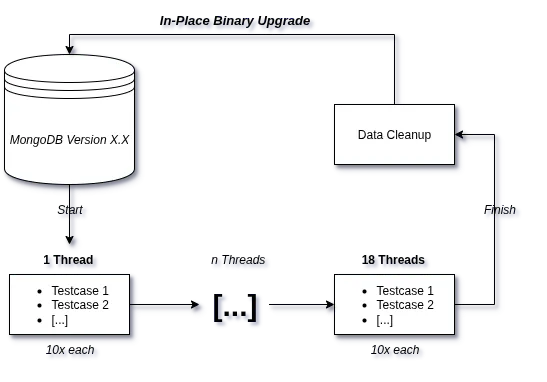
Here, it’s how the benchmark process took place:
#!/usr/bin/bash

tests=("simple_insert" "simple_remove" "simple_update" "complex_insert" "complex_update" "partial_index")
threads=(1 2 4 8 16)

# Run the main set of tests
for t in "${tests[@]}"; do
    for th in "${threads[@]}"; do
        for i in {1..10}; do
            echo "==== Test $t with $th threads, Round $i ===="
            python3.8 -u benchrun.py -f testcases/$t.js -- host 192.168.15.70 -- port 27017 -- replset rs0 -u admin -p sekret -t $th -- trialTime 1 -- out /home/jean/benchtools/results/8.0-$t-$th-$i.json -- tsvSummary true -- writeCmd true -- readCmd true -w 1
        done
    done
done

# Run the separate test with simple_query.js and -- includeFilter core
echo "==== Running simple_query.js with core filter ===="
for th in "${threads[@]}"; do
    for i in {5..10}; do
        echo "==== Test simple_query with $th threads, Round $i ===="
        python3.8 -u benchrun.py -f testcases/simple_query.js -- host 192.168.15.70 -- port 27017 -- replset rs0 -u admin -p sekret -t $th -- trialTime 1 -- out /home/jean/benchtools/results/8.0-simple_query-$t-$th-$i.json -- tsvSummary true -- writeCmd true -- readCmd true -w 1 -- includeFilter core
    done
done
It’s a shell script that interacts with the testcases from the mongo-perf tool as listed before; From the benchmark tool, worth mentioning are the options used:
-t $th:
- This defines the number of threads to use in the benchmark.
- The $th variable is dynamically replaced by values in the loop (e.g., 1, 2, 4, 8, 16).
-trialTime 1:
- This defines the duration of each trial in seconds; In the test, each trial runs for 1 second.
-writeCmd true:
- This enables the use of write commands (e.g., insert, update, delete) instead of legacy write operations.
- MongoDB introduced write commands in newer versions for more efficient write operations.
-readCmd true:
- This enables the use of read commands (e.g., find, getMore) instead of legacy read operations.
-w 1:
- Specifies the write concern level.
As a summary for the script, each CRUD test ran ten times for the number of threads given(1, 2, 4, 8, 16) for the duration of one second.
- For example: The simple_insert.js is a script that tests different inserts operations, each of those operations ran for 1 second, 10 times using 1 thread. After finishing that sequence of operations, the loop restarts, but this time the operations for simple_insert.js will be tested with 2 threads, then 4 and so on until it extinguishes the thread variable.
After executing all the CRUD scripts mentioned for a release, a data cleanup was performed. For each operation tested, we will have 10 distinct outputs. The outliers (the fastest and slowest) were removed*,* and the other 8 remaining operations are summed up and divided, generating an average of values for that operation.
- For example: The simple_insert.js has the operation Insert.EmptyCapped, which basically tests the Insertion of an empty document into a capped collection. We then have 10 distinct execution times running with 1 thread: 547.96, 552.54, 561.64, 562.18, 562.73, 564.83, 567.14, 570.20, 542.68, 567.62. The outliers would the highest number = 570.20 and the lowest number = 542.68; The average operations per second would be 560.83.
This calculation was applied to all operations for all threads and was organized into tables, which you can see and follow in part 2, where we have the finalized report.
See you there!